April 2025: following the Treasury reversal
April 2025 is a good test of how quickly I reach for an explanation after seeing a chart.
The US announced a large tariff package on April 2. Risk assets fell, Treasury yields declined, and the first part of the market response resembled a flight to safety. Then longer-term Treasury yields rose sharply. The dollar also weakened during the broader episode.
It is tempting to stop at “investors lost confidence in US assets.” That is a hypothesis worth examining. It does not tell me which investors sold which assets, which positions they were unwinding, or whether a currency hedge could explain part of the dollar move without a bond sale at all.
Those are the details I wanted to chase.
The direction changed within the same episode
| Observation date | 2-year yield | 10-year yield |
|---|---|---|
| April 2, 2025 | 3.91% | 4.20% |
| April 4, 2025 | 3.68% | 4.01% |
| April 11, 2025 | 3.96% | 4.48% |
Source: Federal Reserve H.15 via FRED, DGS2 and DGS10.
The 10-year yield fell 19 bp from the April 2 observation to April 4, then rose 47 bp by April 11. The two-year also reversed, but its second move was smaller: an increase of 28 bp. The curve steepened during that selloff.
Timing deserves a note here. These Treasury par-curve observations use indicative quotations around 3:30 p.m. Eastern. The April 2 observation precedes the major tariff announcement later that day; it is a baseline, not a post-announcement quote. Daily observations also miss the intraday extremes discussed in market coverage.
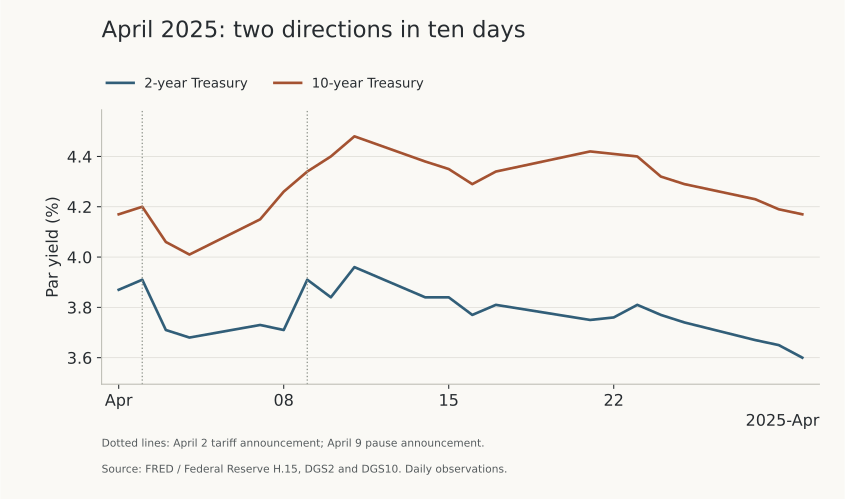
A growth scare can increase demand for Treasuries, while concerns about inflation, longer-term risks or the cost of carrying positions can push yields in the other direction. The reversal tells me that a single “risk-off” label is too broad to describe the entire window. It does not, on its own, tell me the weight of each influence.
“Hedge-fund unwinding” needs a second sentence
The May 9 account from Roberto Perli at the New York Fed gives a useful distinction. He identified the unwinding of swap-spread positions as one factor that appeared to contribute to the rise in longer-term Treasury yields.
A swap spread is commonly quoted as the fixed swap rate minus the yield on a Treasury of comparable maturity. One way to position for a widening spread is to buy the Treasury, finance it in repo, and pay fixed in an interest-rate swap with comparable rate sensitivity. Such a position benefits, in first-order terms, if the Treasury yield falls relative to the swap rate.
Closing it can involve selling the Treasury. Perli described investors who had positioned for a relative improvement in Treasury demand, including expectations around banking regulation, and then unwound those positions.
That is different from a cash–futures basis trade, which pairs a financed Treasury position with a Treasury futures hedge. The counterpart, expected convergence and relevant risks differ.
This is where the official account surprised me. Perli reported that repo funding remained orderly and that Desk estimates showed the cash–futures basis remained relatively stable. His account did not find evidence of the kind of broad basis-trade unwind seen in March 2020.
That finding does not establish that no individual fund reduced a basis position. It means the evidence in that account did not support using a large-scale basis unwind as the general explanation for April's turmoil. The phrase “leveraged investors sold” needs the name of the trade before I know what I have learned.
It also makes me wary of interpreting a large short position in Treasury futures as an outright bearish view. The short can be one leg of a position whose other leg is a long cash Treasury.
A weaker dollar does not identify a bond seller
A BIS Bulletin on the dollar's April 2025 decline examines another mechanism: non-US investors adding currency hedges to existing US asset holdings.
An investor can keep a US bond while using an FX forward or swap to reduce exposure to a further dollar decline. That action changes the investor's currency risk without requiring the bond to be sold. The BIS researchers point to evidence consistent with increased hedging, including the timing of exchange-rate moves.
In a later review of safe-haven properties and portfolio flows, the BIS observed weaker historical relationships between Treasuries and some measures of risk aversion. But the available flow evidence did not show a lasting, material reallocation away from US assets over the period they examined: much of the April selling reversed in May and June.
I find that combination more useful than a definitive verdict on whether Treasuries had “lost” safe-haven status. A changing correlation is evidence about price behavior. A portfolio reallocation is a claim about holdings. The evidence required for the two claims is different.
Compare the stress with March 2020 before calling it a repeat
Treasury cash-market liquidity did worsen in April. Perli's account described wider trading frictions and greater volatility, but emphasized that dealers continued to handle substantial two-way flows and funding remained available.
The New York Fed's later liquidity review found that liquidity deterioration was broadly consistent with the increase in volatility. Bid-ask spreads widened less than in March 2020, and conditions improved after the April 9 announcement postponing most new country-specific tariffs.
That comparison helps me distinguish a market that is more expensive to trade from one where the mechanisms connecting related prices are breaking down. Both deserve attention. They are different diagnoses.
I am left wanting a dashboard that puts cash-market depth, repo conditions, swap spreads and the cash–futures basis beside the usual yield curve. It would not solve the problem of attribution, but it would make me slower to attach the same explanation to two superficially similar charts.
The enjoyable part of this exercise is that reading the first plausible account opened more questions. Reading the next one made those questions more specific. For someone learning rates, that feels like progress.
The research package reproduces the chart and the endpoint comparisons. This essay uses subsequent research to interpret the episode; it is not a real-time forecast or an estimate of how much each mechanism moved yields.
Related: March 2020's dash for cash and the September 2019 repo spike.