Two ways the Treasury curve can steepen
Independent research note. Historical observations: January–December 2024. Trade sizes and durations below are hypothetical.
The US Treasury curve steepened in two different rate environments during the second half of 2024. From June 28 to September 16, the 2-year yield fell more than the 10-year yield. From September 16 to December 31, both yields rose, with the larger increase at the 10-year point.
A view that the curve will steepen therefore needs a second decision: how much outright duration to hold. Buying a long-dated Treasury and buying a curve steepener produce different exposures, even if the same economic forecast motivates both trades.
Start with the two legs
Define the 2s10s slope as the 10-year Treasury yield minus the 2-year yield. A positive change means steepening. A basis point, or bp, is 0.01 percentage point.
| Observation date | 2-year yield | 10-year yield | 2s10s slope |
|---|---|---|---|
| June 28, 2024 | 4.71% | 4.36% | −35 bp |
| September 16, 2024 | 3.56% | 3.63% | +7 bp |
| December 31, 2024 | 4.25% | 4.58% | +33 bp |
Source: Federal Reserve H.15 via FRED, DGS2 and DGS10. Download the endpoint table.
Across the first interval, the 2-year yield declined 115 bp and the 10-year yield declined 73 bp. The curve steepened 42 bp as Treasury prices rose: a bull steepening. Across the second, the respective increases were 69 bp and 95 bp. The curve steepened another 26 bp as prices fell: a bear steepening.
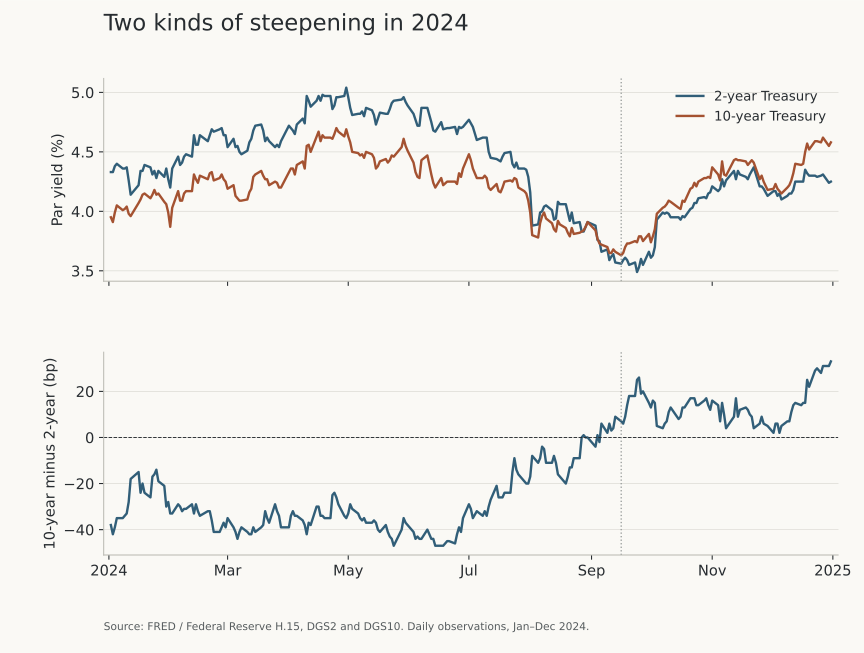
The Fed cut its target range by 50 bp on September 18, 2024. That timing provides context for the earlier decline in front-end yields. These endpoint comparisons do not establish how much of either move came from monetary policy, inflation news, Treasury supply, or term premium. The dates were selected after the fact to illustrate two regimes, rather than to test a forecasting rule.
Translate the view into risk
A cash 2s10s steepener can combine a long 2-year position with a short 10-year position. Matching face amounts would leave substantial long-end rate exposure because the longer bond has greater price sensitivity.
Use DV01, the dollar price change associated with a one-basis-point yield move, to size the legs. With market value and modified duration :
Assume a long 2-year position worth USD 10 million with modified duration 1.9. Its DV01 is about USD 1,900 per bp. If the 10-year bond's modified duration is 8.1, a short market value of about USD 2.346 million matches that sensitivity:
For small yield changes, with each change expressed in basis points, the combined price P&L is:
| Hypothetical scenario | 2-year move | 10-year move | Price P&L |
|---|---|---|---|
| Bull steepening | −25 bp | −5 bp | +USD 38,000 |
| Bear steepening | +5 bp | +25 bp | +USD 38,000 |
| Parallel selloff | +25 bp | +25 bp | USD 0 |
| Flattening | +5 bp | −5 bp | −USD 19,000 |
Both steepening scenarios generate the same first-order result because the slope increases by 20 bp in each. A parallel move cancels only within this approximation. Convexity differs across the two bonds, and their DV01s change as yields and remaining maturities change.
The work between a curve view and an executable trade
The public series describe Treasury constant-maturity par yields. Treasury interpolates these rates from a fitted curve; they do not identify bonds that can be purchased at those yields.
An implementation needs actual CUSIPs, settlement prices, accrued interest and cash flows. A strategist would then calculate each bond's DV01 and convexity, obtain financing for the long leg, and establish the cost and availability of borrowing the short. A scarce Treasury can trade “special” in repo, reducing the cash-lending return available to obtain it and making the short expensive to maintain.
The trade also needs a horizon. Coupon income, roll down the curve and financing can outweigh a small slope move over a short holding period. A DV01-matched position is not cash-neutral, so the two legs' market values and financing balances need separate treatment.
A research conclusion with a testable condition
An expectation that policy easing will pull the 2-year yield down more than the 10-year yield supports examining a bull steepener. A view that long-end yields will rise more than front-end yields supports examining a bear steepener. In either case, the decision depends on the expected slope change after carry, funding and execution costs.
The thesis weakens if the curve flattens, if the expected catalyst fails to arrive within the stated horizon, or if financing consumes the expected gain. A useful follow-up note would report both yield changes, the slope change and each leg's contribution to P&L. “Rates rallied” alone would leave the central trade question unanswered.
Reproduce the analysis
The Python script aligns observed dates without filling missing yields, generates the chart, and calculates the hypothetical scenarios. The research package includes raw CSVs, source URLs, integrity hashes and methodology. The calculations illustrate exposure; they are not a strategy backtest.
Continue with real yields and TIPS breakevens or Treasury carry after funding.