The Fed's verbs: tapering in 2013, runoff in 2018
I went into this reading with a vocabulary problem. Tapering, tightening, runoff, selling bonds: all of them sound like the Fed taking something away. The Treasury market gives them rather different meanings.
The original “taper tantrum” was in 2013. The late-2018 scare involved rate hikes and the runoff of an existing balance sheet. Putting the two episodes next to each other is useful because the long end of the Treasury curve moved in opposite directions over the windows below.
Apparently, the verbs in a central-bank statement deserve this much attention.
2013: buying less still meant buying
In May 2013, the Fed was buying USD 45 billion of longer-term Treasuries and USD 40 billion of agency mortgage-backed securities each month. Bernanke described that policy in his May 22 testimony.
The possibility of reducing those purchases brought the future of that support into focus. At his June 19 press conference, Bernanke outlined a conditional path: if the economy developed as expected, the Fed could moderate purchases later in the year and end them around the middle of the following year.
Conditional is doing important work there. This was a description of how policy might evolve with the economy, not a fixed calendar promise.
The 10-year yield rose from 1.94% on May 21 to 2.98% on September 5, a 104 bp increase. The two-year rose from 0.26% to 0.52%, a much smaller 26 bp move. Over that interval, investors demanded substantially higher yields at the long end even though the Fed had not raised its overnight policy target.
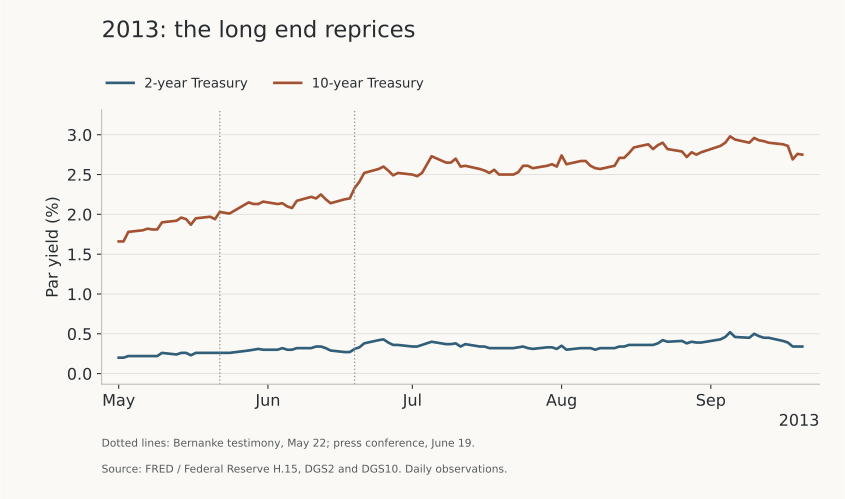
Several mechanisms could contribute. Investors could expect a different path for future short rates. They could require more compensation to hold long-duration bonds as the outlook for Fed purchases changed. Economic news could change both judgments. A yield chart does not identify the contribution of each mechanism.
The actual taper announcement came in December: monthly purchases would fall from USD 85 billion to USD 75 billion starting in January 2014. The Fed's holdings would still increase, just more slowly. It also continued reinvesting principal payments.
That is the detail I want to remember. A change in the expected pace of future buying can move prices before the central bank reduces its current purchases, let alone sells anything.
2018: the balance sheet was already shrinking
By late 2018, the Fed was raising rates and allowing a capped amount of maturing securities to run off without reinvestment. Runoff reduces holdings through repayments. It does not require the Fed to enter the market and sell the same amount of bonds outright.
On December 19, the Fed raised its target range to 2.25–2.50%. At the press conference, Powell explained the choice to put balance-sheet runoff on “automatic pilot” while using the policy rate to respond to incoming data.
It is easy to see why that phrase drew attention during a difficult period for markets. But the Treasury chart complicates a simple story about tightening causing a bond selloff.
From November 8 to December 31, the 10-year yield fell from 3.24% to 2.69%, or 55 bp. The two-year fell from 2.98% to 2.48%, or 50 bp. Long Treasuries rallied across that period even as the Fed delivered its December hike.
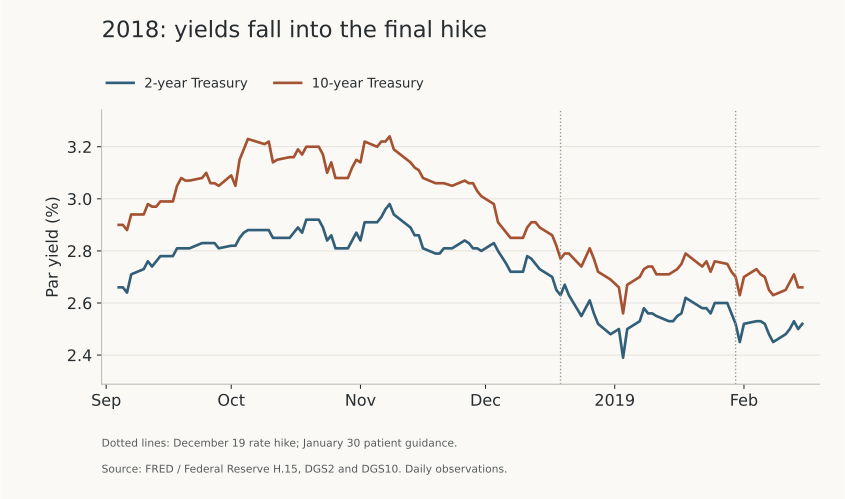
That is not a contradiction once I stop treating the current policy rate as the sole input to a Treasury yield. Investors were assessing the future economy, future policy and the value of holding government bonds during a risk-asset selloff. A hike today can coexist with a lower expected path for rates further ahead.
On January 30, 2019, the Fed said it would be patient in determining future adjustments. In a separate balance-sheet statement, it said it was prepared to adjust the details of normalization in light of economic and financial developments.
Those statements changed guidance. They did not mean that the Fed cut its target that day or reversed every part of its earlier policy at once.
The comparison I am keeping in my notes
| Question | 2013 | Late 2018 |
|---|---|---|
| What was happening to bond holdings? | They were expanding through purchases. | They were declining through capped runoff. |
| What attracted attention? | The prospect of slower future purchases. | Continued hikes and the approach to runoff. |
| What did the selected 10-year window show? | A 104 bp yield rise. | A 55 bp yield decline. |
This comparison makes me cautious about treating “less central-bank support” as a complete trade thesis. I still need to specify which instrument changes, what investors already expected, and which part of the curve expresses the view.
I also want to distinguish a policy surprise from an economic surprise. A central bank can announce less support because it believes the economy is improving. The same announcement can therefore contain information about both the policy reaction and the outlook. Separating those is harder than drawing a vertical line on a chart.
For now, I am keeping two timelines beside each other: what the Fed did, and what it suggested it might do next. They will not explain every yield move, but they stop me from describing a slower purchase program as a sale of assets or a falling Treasury yield as proof of a rate cut.
Sources for yields: Federal Reserve H.15 via FRED, DGS2 and DGS10. The research package reproduces both charts and the endpoint changes. The windows illustrate different episodes; they are not estimates of the causal effect of Fed announcements.
Continue to the repo market's expensive Tuesday in 2019, when the amount and distribution of reserves became much less abstract.