Treasury carry after the funding bill
Independent research note. The repo chart uses 2024 observations. Bond and bill examples use hypothetical inputs.
A Treasury position can earn coupon income and still have negative carry after financing. It can also appear attractive under an unchanged-curve assumption while leaving little protection against a yield increase. Both effects belong in the trade calculation before forming a view on relative value.
Consider a near-par Treasury yielding 4.20%, funded at an annualized 4.60%, with modified duration 4.4. Over a quarter-year, the income-minus-funding approximation is −10 bp of starting market value. If the bond rolls to a point on the curve with a yield 10 bp lower, the first-order price benefit is +44 bp. Together, that is +34 bp before transaction costs.
The roll assumption provides the entire positive return in this example.
Keep income, roll and a market shock separate
For a near-par bullet bond, a useful first-pass estimate is:
Here, yields and yield changes use decimal units; is the horizon in years. Excess return means return after the assumed financing cost, measured against starting bond market value. It is not a return on the investor's haircut or equity capital.
The roll change is the yield at the bond's shorter remaining maturity on today's curve minus its initial yield. An upward-sloping local curve can create positive roll return. This assumes the remaining-maturity curve stays unchanged over the horizon. A forward-curve scenario is a different assumption and can produce a different result.
| Hypothetical case | Net income | Roll benefit | Total excess return |
|---|---|---|---|
| Base assumptions | −10 bp | +44 bp | +34 bp |
| No roll benefit | −10 bp | 0 bp | −10 bp |
| Funding 100 bp higher | −35 bp | +44 bp | +9 bp |
| Additional 25 bp yield rise | −10 bp | +44 bp | −76 bp |
The final row includes a −110 bp price effect from the additional yield shock. Under these assumptions, a rise of about 7.7 bp beyond the roll scenario would consume the base case's 34 bp cushion. That is a more useful risk comparison than quoting the annual yield alone.
Yield times horizon is an income proxy, not exact coupon accounting. A production calculation should reprice the remaining cash flows, include coupon receipts and accrued-interest changes, and subtract financing on the actual cash balance using the relevant day count. It should also include haircuts, coupon reinvestment and execution costs. A full horizon repricing already captures roll; adding a separate roll estimate would double-count it.
Use SOFR to monitor funding conditions
The New York Fed defines SOFR as a broad measure of overnight cash borrowing costs secured by Treasury collateral. It calculates the rate as a volume-weighted median of eligible repo transactions, with filtering to reduce the influence of specials.
A useful public monitor compares SOFR with the Fed's interest rate on reserve balances, or IORB. IORB provides a policy reference for eligible institutions' reserve holdings; it is not a funding rate available to every investor.
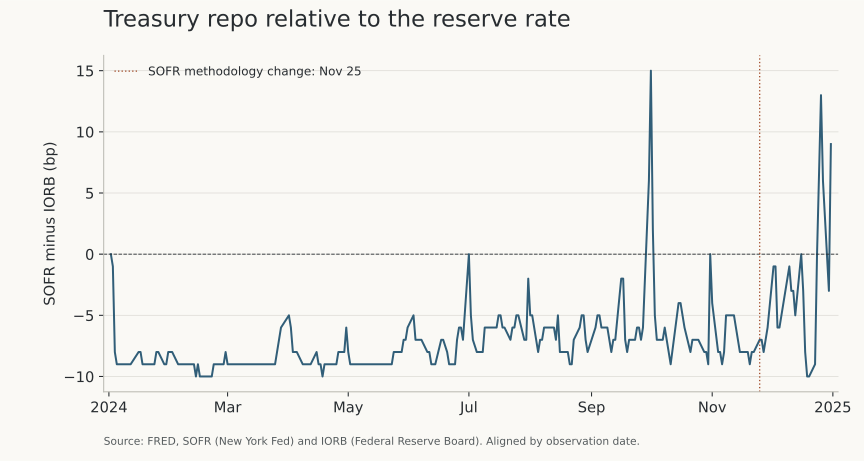
On September 30, 2024, SOFR was 4.96% and IORB was 4.90%, a +6 bp difference. On December 31, the corresponding rates were 4.49% and 4.40%, a +9 bp difference. These observations justify checking financing conditions near reporting dates. They do not establish the cause of the moves or the rate a particular desk could obtain.
The New York Fed changed SOFR's methodology on November 25, 2024, including the treatment of affiliated trades and the low-rate volume trim in the cleared bilateral segment. The chart marks that date because a time-series analysis should record benchmark-definition changes alongside economic events.
SOFR also describes an overnight market. It does not lock three months of financing. For a particular Treasury, the relevant repo rate depends on the security, term, counterparty and balance-sheet conditions. Special collateral can finance below general collateral rates; obtaining that security for a short position can become more costly.
Compare bill yields on the same basis
A bill's bank-discount quote uses face value as its denominator and a 360-day year. An investment return uses the amount paid. Mixing those conventions can create an apparent spread before any economic difference exists.
For a hypothetical 90-day bill quoted at a 4.50% bank-discount rate:
The annualized investment rate on an ACT/360 basis is:
On a 365-day basis, the corresponding simple annualized rate is about 4.6144%. Treasury's bill calculation examples explain these conventions; longer bills require additional care when calculating coupon-equivalent yields.
Even after putting a bill and repo rate on the same day-count basis, a 90-day bill yield and one day's SOFR still have different horizons. A financed-bill comparison needs either locked term funding or a scenario for the daily funding path through maturity.
Make the financing assumption visible
A useful research table should show gross income, roll, financing and a rate shock separately. For the stylized Treasury here, 44 bp of assumed roll offsets 10 bp of negative financed income. A modest adverse rate move can erase the residual. That result makes the next research question concrete: how credible are the unchanged-curve and funding assumptions over the intended holding period?
The Python script generates the carry scenarios, bill conversions and funding observations. The research package documents units, missing-data treatment and the distinction between observation dates and publication times.
Related: Agency and SSA relative value.