March 2020: Treasuries in the dash for cash
The first part of the March 2020 Treasury chart is easy for me to follow. The pandemic threatened economic activity, investors sought protection, and Treasury yields fell. The next part requires more work: long-term Treasury yields rose sharply while the crisis was getting worse.
On March 9, the 10-year constant-maturity yield was 0.54%. On March 18, it was 1.18%. That is a 64 bp increase in nine calendar days, during a period I would have expected to fit neatly under “flight to safety.”
The explanation that interests me begins with investors' obligations. Some of them needed cash to meet redemptions or margin requirements. Selling a Treasury could meet that need even if they still trusted the government to pay it back.
The selling does not settle the question of trust
A Federal Reserve study of foreign demand during the pandemic adds an important detail: foreign private investors bought Treasury bills while selling large amounts of Treasury notes and bonds during the spring of 2020.
That pattern is more informative than a headline saying foreigners sold Treasuries. Bills and long bonds have very different duration, price sensitivity and usefulness for an investor trying to shorten a portfolio and raise cash.
The researchers interpret the sales in the context of the extraordinary demand for liquid assets. The findings do not support treating every sale as a vote against the US government's creditworthiness. They also remind me that the category “foreign investor” contains several kinds of institutions, including funds whose domicile says little about the nationality of their ultimate investors.
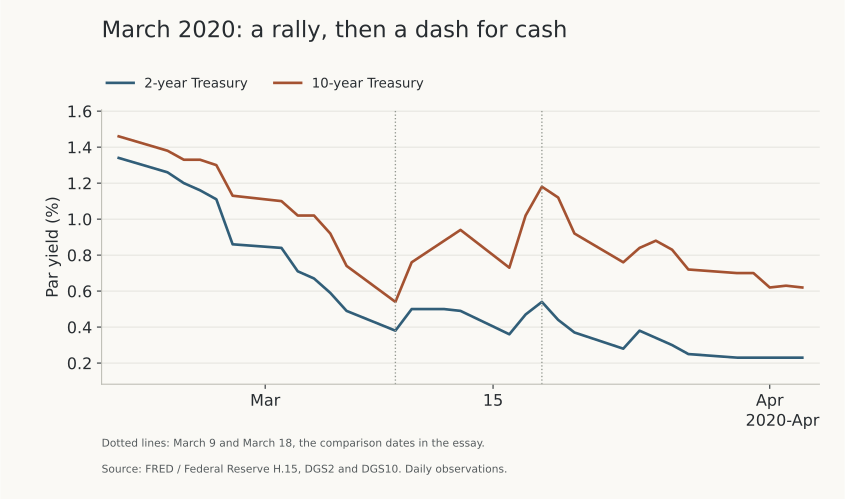
The two-year yield increased only 16 bp between those two dates, from 0.38% to 0.54%. Even within Treasuries, “the bond market sold off” leaves out a lot of information about where the pressure was concentrated.
Someone has to absorb the inventory
I tend to think of a liquid market as one where a buyer will be available. This episode makes me ask what happens between the seller's decision and the eventual buyer's arrival.
Dealers often bridge that gap. They take inventory onto their balance sheets, manage its risk and seek another buyer. Doing that at scale uses capital and financing capacity. If many investors want to sell at once, dealers' willingness to take more inventory can become a constraint.
The Fed's research on collateral reuse describes heavy selling by foreign official and private investors, much of it in off-the-run Treasuries. These are older issues, rather than the most recently issued benchmark securities. Dealers absorbed sales, but their willingness to intermediate declined as pressures on their balance sheets grew.
The market's size did not remove that constraint. A huge stock of outstanding bonds can coexist with limited capacity to absorb an unusual volume of sales over a few hours.
That is why I want evidence beyond a yield move when calling an episode a liquidity problem: bid-ask spreads, available depth, price impact and deviations among related securities. A yield increase by itself could reflect a change in macroeconomic expectations. Impaired execution and unusual relative prices tell me something additional.
A small basis can involve a large position
The cash–futures basis trade adds another layer. In one common version, an investor buys a Treasury, finances it through repo and sells a related Treasury futures contract. The investor seeks to earn the difference between the cash and futures pricing after financing and other costs.
The expected difference can be small, which encourages leverage. That makes the cash needed along the way important. A position expected to converge at a future date can still create a problem today if margin requirements rise, relative prices move against it, or a risk manager asks for a smaller balance sheet.
Closing that version of the trade involves selling the cash Treasury and buying back the futures short. In a stressed market, that can add to the same selling pressure that prompted the deleveraging.
I do not want to assign the entire episode to this one trade. In Hedge Fund Treasury Trading and Funding Fragility, researchers document a substantial reduction in hedge-fund Treasury exposure, with basis traders facing greater margin pressure. They also find that average bilateral repo volumes and haircuts remained relatively stable and that large regulated dealers supplied funding.
Those findings make a blanket claim that hedge funds could no longer borrow too crude. Funds could reduce exposures to protect their own liquidity even where financing remained available. Redemption needs, precautionary cash demand and dealer capacity belong in the account as well.
The intervention addressed market functioning
On March 15, the Fed announced purchases of at least USD 500 billion in Treasuries, alongside agency mortgage-backed securities purchases, to support smooth market functioning. On March 23, it committed to purchases in the amounts needed for that purpose and the transmission of monetary policy.
The wording helps distinguish two policy questions: where officials wanted the overnight interest rate, and whether investors could transact in markets that the rest of the financial system relies on. A low policy rate would not, by itself, guarantee that a dealer could absorb an exceptional wave of Treasury sales.
The lesson I keep coming back to concerns holding periods. An investor who can wait for maturity faces a different problem from an investor with a margin call this afternoon. Both can own the same bond. Looking only at the bond's credit quality will not explain their decisions.
I now want to understand how much cash an investor needs to keep a supposedly hedged position open through a bad week. The end-of-trade payoff is only part of that calculation. March 2020 makes the path to that payoff hard to ignore.
Yield data: Federal Reserve H.15 via FRED, DGS2 and DGS10. The research package includes the source observations and chart code. This retrospective combines price data with subsequent research; it does not estimate each seller group's contribution to the yield move.
For a useful comparison, read April 2025's Treasury reversal, when cash-market liquidity worsened but repo funding remained much more orderly.